Are your Cows Trending?
Dairy farms generate huge amounts of data—some find it invaluable, others struggle to link it to daily decisions. And let’s be honest: a graph on its own never made anything better. But spotting trends and setting trigger points for review, that’s where the value lies.
Keep it simple. One of my college lecturers was a firm believer in the KISS principle—Keep It Simple, Stupid. It’s easy to drown in data, but unless the basics are right, the numbers won’t fix anything. When trends start heading the wrong way, or key figures drift off track, it’s time to step back and reassess the fundamentals.
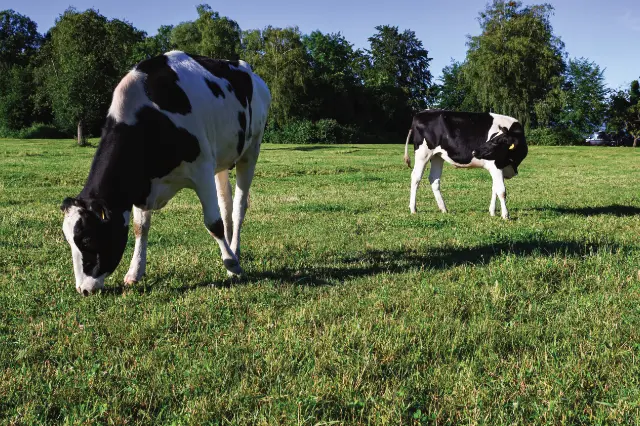
Calf Growth Rates
Why measure calf growth? Because even small gains pay off. Research shows an extra 100g/day during pre- weaning can mean 100kg more milk in a heifer’s first lactation. Tracking growth tells you whether things are improving and helps judge if changes are working. Don’t get bogged down chasing the “perfect” figure—watch the trend, and aim for progress.
Short on time? Our Focus Team can take care of the measuring, monitoring, and planning so you can focus on the day-to-day.
Age at First Calving
Another key marker: age at first calving. Earlier calving means more lifetime milk, better fertility, and lower rearing costs. The 24-month target is ideal, but the main focus should be your own farm’s trend. Where are the bottlenecks? What’s slowing things down? A fresh set of eyes from your advisory team can highlight practical fixes.
Mobility and Lameness Costs
Most farms now get regular mobility data to meet Red Tractor standards— but are we using it? In 2023, a lame cow (score 2 or 3) cost an estimated £3.30 per day. That might sound vague, but the knock-on effects on yield, fertility, and culling are very real. Mobility data shows whether things are improving or not. Foot trimming records add the “why.”
Used together, they help focus time and money on cost-effective, trackable solutions that actually make a difference.
Using On-Farm Data Effectively
With milk recording, software dashboards, and farm apps, most units are swimming in data. The challenge is knowing what to track, when to take action, and—most importantly—when to ignore the noise. A single figure on its own doesn’t mean much. It’s the direction of travel that matters.
Trends in somatic cell counts, conception rates, or service intervals can all flag up problems before they become costly. But only if you’re watching them closely—and with clear targets in mind.
Team Up on the Numbers
Data is only useful when shared. The best results come when you and your trusted advisors review key figures together, spot patterns, and decide what needs adjusting. Knowing where the bottlenecks are—and proving that changes work—is how real progress is made.
Want to make better use of your data?
Get in touch, we’ll help you choose what to monitor, track the right trends, and make sure your figures work for you—not against you.